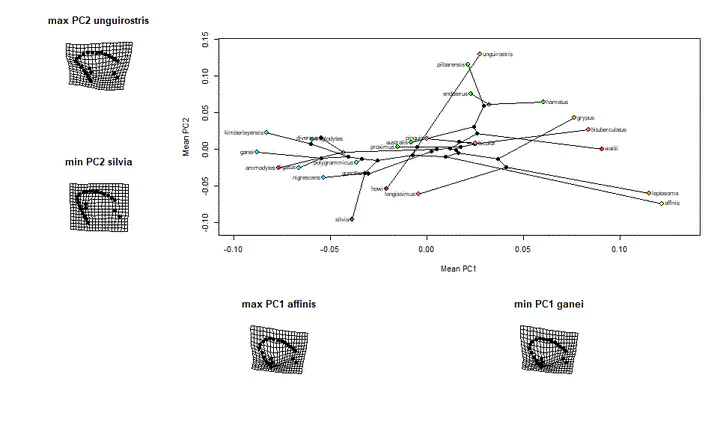
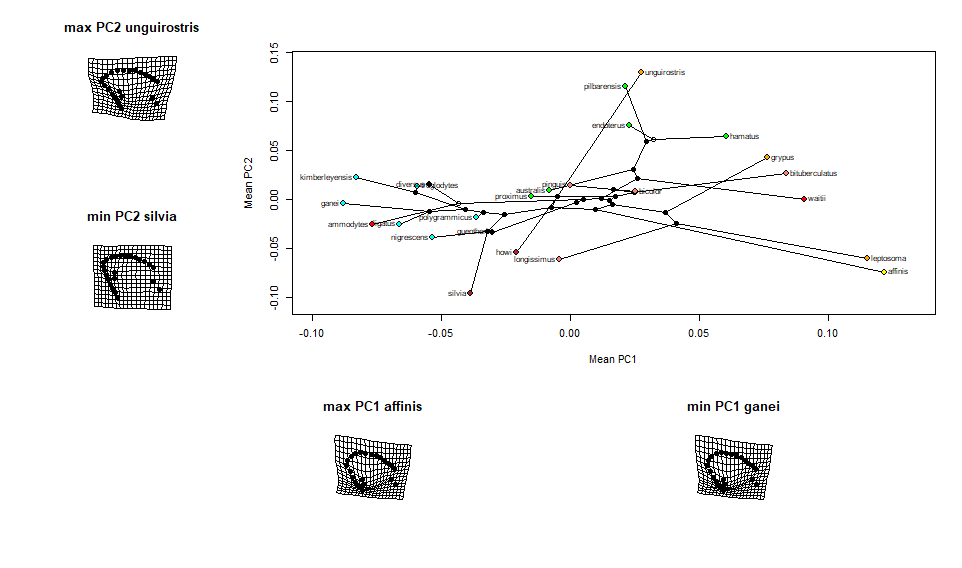
Phylomorphospace plot with relative values
Update Sept 2021: For the latest update please visit this Bitbucket repository
แปะไว้ให้ตัวเองจำ … วันหน้าอาจจะมาเขียน tutorial ดีๆ
เวลาจะแสดงความแตกต่างของลักษณะ geometric morphometrics ระหว่างสิ่งมีชีวิตหลากหลายสายพันธุ์ ข้อมูลที่สำคัญคือ:
- ความสัมพันธ์ระหว่างสายพันธุ์
- รูปลักษณะที่แตกต่างจากค่าเฉลี่ยของ species ที่ได้คะแนนสุดขั้ว
วันนี้นั่งวิเคราะห์งานอยู่จึงหาวิธีเขียน function ที่สามารถแสดงผลออกมาเป็น figure ได้ทันที อาจจะไม่สวยหรูแต่ช่วยได้เวลาจะเอาไปนำเสนอกับผู้ร่วมงานหรืออาจารย์ที่ปรึกษา
ถ้าใครสนใจ จะทำ figure อย่างในรูปขั้นต้นลองปรับ code ด้านล่างนี้ใช้นะครับ สิ่งสำคัญที่ต้องมีคือ
- species tree
- data frame ที่มี mean PC1 และ PC2 สำหรับแต่ละ species
- array ที่มี คะแนน landmark เฉลี่ยของทุกตัวอย่าง
Packages:
- geomorph
- phytools
R code for the anilios.phylomopho.maker() function
anilios.phylomopho.maker <- function(ypcs.df, means3d.df) {

    # make a subset of mean pca scores that we have tips for head shape
    Ypcs.trim <- ypcs.df %>%
      semi_join(tree.tips, by = c('species' = 'species_in_tree'))
    # prune tree again for only tips that we have data for
    head_shape_df_tips <- as.vector(Ypcs.trim$species)
    # PRUNED tree for head shape data
    Ypcs.trim.tree <- sub_mt_tree %>%
      keep.tip(., head_shape_df_tips)
    # PCA matrix for head shape
    pca.headshape.matrix <- as.matrix(Ypcs.trim[c("mean_PC1", "mean_PC2")])
    rownames(pca.headshape.matrix) <- as.vector(Ypcs.trim$species)

  # plot layouts
  layout(matrix(c(1,2,2,
                  3,2,2,
                  4,5,6
                  ), 3, 3, byrow = TRUE),
         widths = c(1,1,2), heights = c(1,1,1))

  # plot extreme values
  means3d <- means3d.df
  Ypcs <- as.matrix(ypcs.df)
  # PC2max
  plotRefToTarget(mshape(means3d),
                  mshape(means3d[,,which(Ypcs[,2]==max(Ypcs[,2]))]))
  title(main = paste("max PC2", names(which(pca.headshape.matrix[,2]==max(pca.headshape.matrix[,2])))))

  # plot phylomorphospace of head shape data
  phylo_plot <- phylomorphospace(Ypcs.trim.tree, pca.headshape.matrix, label = "horizontal",
                                 fsize = 1,
                                 xlab = "Mean PC1", ylab = "Mean PC2",
                                 control = list(col.node=color.all))
  # PC2 min
  plotRefToTarget(mshape(means3d),
                  mshape(means3d[,,which(Ypcs[,2]==min(Ypcs[,2]))]))
  title(main = paste("min PC2", names(which(pca.headshape.matrix[,2]==min(pca.headshape.matrix[,2])))))

  plot.new()


  # PC1 max
  plotRefToTarget(mshape(means3d),
                  mshape(means3d[,,which(pca.headshape.matrix[,1]==max(pca.headshape.matrix[,1]))]))
  title(main = paste("max PC1", names(which(pca.headshape.matrix[,1]==max(pca.headshape.matrix[,1])))))

  # PC1 min
  plotRefToTarget(mshape(means3d),
                  mshape(means3d[,,which(Ypcs[,1]==min(Ypcs[,1]))]))
  title(main = paste("min PC1", names(which(pca.headshape.matrix[,1]==min(pca.headshape.matrix[,1])))))

  }


# Plot the phylomorphospace
anilios.phylomopho.maker(ypcs.df = Ypcs.dorsal.df, means3d.df = means3d.dorsal)
Sarin 'Putter' Tiatragul
PhD Candidate
I’m a Thai PhD candidate at the Research School of Biology (ANU). I go by the name “Putter”.